Motif Enrichment#
Setup#
Download a MEME motif database file containing human transcription factor binding motifs from the Cis-BP resource, alongside the human genome in fasta format.
%%bash
[ -f data/cisBP_human.meme ] || wget -O data/cisBP_human.meme https://osf.io/download/uk6vn
[ -f data/GRCh38.fa ] || wget -O data/GRCh38.fa.gz https://ftp.ebi.ac.uk/pub/databases/gencode/Gencode_human/release_38/GRCh38.p13.genome.fa.gz
[ -f data/GRCh38.fa ] || gunzip -c data/GRCh38.fa.gz > data/GRCh38.fa
import gatac as ga
import scanpy as sc
import anndata as ad
import matplotlib.pyplot as plt

sc.set_figure_params(dpi=100, frameon=False)

GENOME_FASTA = "data/GRCh38.fa"
MOTIF_FILE   = "data/cisBP_human.meme"

peak_adata = ad.read_h5ad("data/pbmc_peaks.h5ad")
print(peak_adata)
AnnData object with n_obs × n_vars = 5001 × 178350
    obs: 'barcode', 'n_unique', 'tsse_score', 'duplicate_fraction', 'mito_fraction', 'leiden'
1. Load motifs#
motifs = ga.tl.read_motifs(MOTIF_FILE, unique=True)
print(f"Loaded {len(motifs)} motifs")

# Inspect a single motif
m = motifs[0]
print(f"\nExample motif:")
print(f"  ID:     {m.id}")
print(f"  Name:   {m.name}")
print(f"  Family: {m.family}")
print(f"  Length: {m.pwm.shape[0]} bp")
print(f"  Info:   {m.info_content():.2f} bits")
Loaded 1165 motifs

Example motif:
  ID:     AC023509.3+M02872_2.00
  Name:   AC023509.3
  Family: None
  Length: 14 bp
  Info:   17.31 bits
peaks = ga.tl.marker_peaks(adata=peak_adata, groupby="leiden")

markers = {}
for leiden, df in peaks.items():
    markers[leiden] = df.loc[df.log2_fc > 0][:1000].feature.values.tolist()
15:30:58 - gatac.tl.markers - INFO - Running marker peak detection for groups in 'leiden'
15:30:58 - gatac.tl.markers - INFO - Testing 13 groups, 178,350 features, 5,001 cells
15:30:58 - gatac.tl.markers - INFO - Using max_cells=500 per group for balanced comparison
15:31:00 - gatac.tl.markers - INFO - Marker peak detection complete. Results stored in adata.uns['marker_peaks']
2. Run motif enrichment#
import time
import numpy as np

t0 = time.perf_counter()
enrichment_results = ga.tl.motif_enrichment(
    motifs,
    regions=markers,
    genome_fasta=GENOME_FASTA,
)
print(f"Motif enrichment in {time.perf_counter() - t0:.1f}s")
15:31:06 - gatac.tl.motif - INFO - Fetching 9823 sequences...
15:31:09 - gatac.tl.motif - INFO - Encoding sequences for GPU...
15:31:09 - gatac.tl.motif - INFO - Precomputing score thresholds for all motifs...
15:31:14 - gatac.tl.motif - INFO - Scanning 1165 motifs across 9823 regions...
15:31:29 - gatac.tl.motif - INFO - Motif enrichment analysis complete
Motif enrichment in 22.5s
enrichment_results["0"].sort_values("adjusted p-value").head()
| id | name | family | log2(fold change) | p-value | adjusted p-value | |
|---|---|---|---|---|---|---|
| 488 | NFE2L2+M08789_2.00 | NFE2L2 | None | 1.190888 | 0.000020 | 0.015983 |
| 60 | CEBPA+M08076_2.00 | CEBPA | None | 1.336208 | 0.000027 | 0.015983 |
| 712 | SPIB+M03008_2.00 | SPIB | None | 0.695308 | 0.000051 | 0.019878 |
| 31 | BACH1+M09488_2.00 | BACH1 | None | 1.058600 | 0.000084 | 0.024537 |
| 713 | SPIC+M03005_2.00 | SPIC | None | 0.707267 | 0.000262 | 0.060981 |
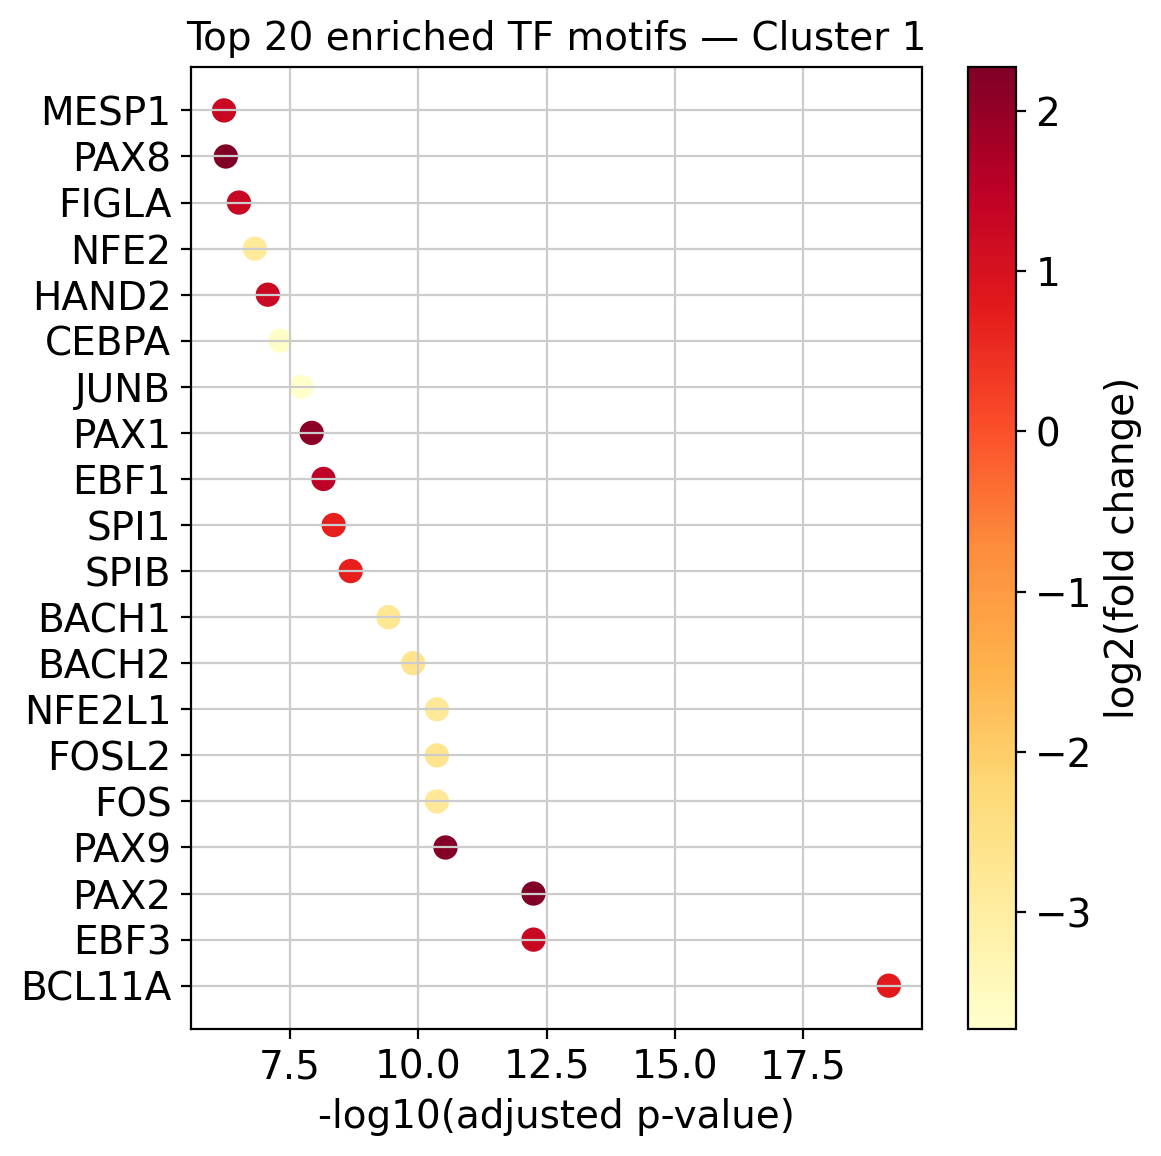
3. Visualize top enriched motifs#
# Show top 20 enriched motifs for a chosen cluster
cluster_id = "1"
df = enrichment_results[cluster_id]

top20 = df.nsmallest(20, "adjusted p-value")

fig, ax = plt.subplots(figsize=(6, 6))
sc = ax.scatter(
    -np.log10(top20["adjusted p-value"] + 1e-300),
    range(len(top20)),
    c=top20["log2(fold change)"],
    cmap="YlOrRd",
    s=60,
)
plt.colorbar(sc, ax=ax, label="log2(fold change)")
ax.set_yticks(range(len(top20)))
ax.set_yticklabels(top20["name"])
ax.set_xlabel("-log10(adjusted p-value)")
ax.set_title(f"Top 20 enriched TF motifs — Cluster {cluster_id}")
plt.tight_layout()
plt.show()
Next steps#
04 – chromVAR: per-cell TF activity scores
05 – GSEA: preranked GSEA on motif gene sets